Good usage of resources on HPC cluster

Theory

On a HPC cluster such as Baobab, the resources are shared between the user community. For this reason it’s important to use them wisely. An allocated resource is unavailable for others during the complete lifespan of the job. The issue arise when the resource is allocated but not used.

Definition: on the HPC world, when we talk about CPU, we mean core. A standard compute node has 2 physical CPUs, and 20 cores. So we say this node has 20 CPUs.

The resources available on a cluster such as Baobab are:

  • CPUs, which are grouped in partitions
  • GPGPUs which are accelerator for software which support them
  • memory (RAM) per core or per node, 3GB by default
  • disk space
  • time, duration of the computation

There exists three family of job with different resource needs:

  • mono threaded, such as Python, plain R, etc. They can only use one CPU.
  • multi threaded, such as Matlab, Stata-MP etc. They can use in best case, all the CPUs of a compute node
  • distributed such as Palabos. They can spread tasks on various compute nodes. Each task (or worker) require one CPU. Keyword to identify such program could be OpenMPI.
  • hybrid each tasks of such a job behave like a multi-threaded job. Not very common.

On the cluster, we have two type of partitions with a fundamental difference:

  • with resources allocated per compute node: shared-EL7, parallel-EL7
  • with resources allocated per cpu: all the other partitions

Bad CPU usage.

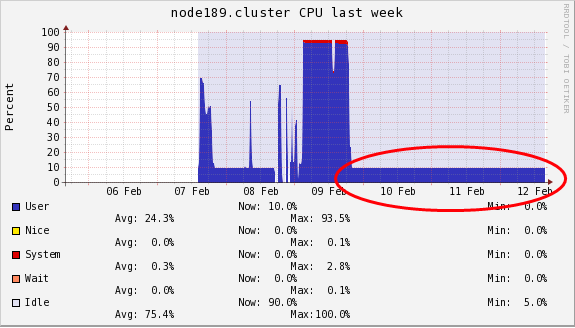
Let’s take an example of a mono threaded job. You should clearly use a partition which allows to request a single CPU, such as mono-shared-EL7 and ask one CPU only. If you ask the wrong partition type or too much CPUs, the resources will be reserved for your job but only one CPU will be used. See the screenshot below of such a bad case where 90% of the compute node is idle.
image

Bad memory usage.

Another misuse of the resource, is to ask too much RAM without using it. Baobab have many compute nodes with 48GB. If you request for example 40GB of RAM and 1 CPU, only two other CPU of this compute node may be allocated for another job, the remaining will stay unused by lack of memory. This is ok as long as you really use the memory. But in this case, if you job can benefit of more CPU, feel free to request all the other cores of this compute node. You can check the memory usage during the job execution or after.

Bad time estimation

If you submit a job and request 4 days of compute time and your job run effectively for 10 minutes, your time estimation is bad. It’s important for the scheduler that your time estimation is correct. A couple of hours of overestimation is ok. It’s important to have more or less correct time estimation due to the fact that slurm doesn’t only put new job in a fifo queue, but has a backfill mechanism that allows to launch a job that is later in the queue sooner if it doesn’t disturb other job. See the picture below for an explanation.


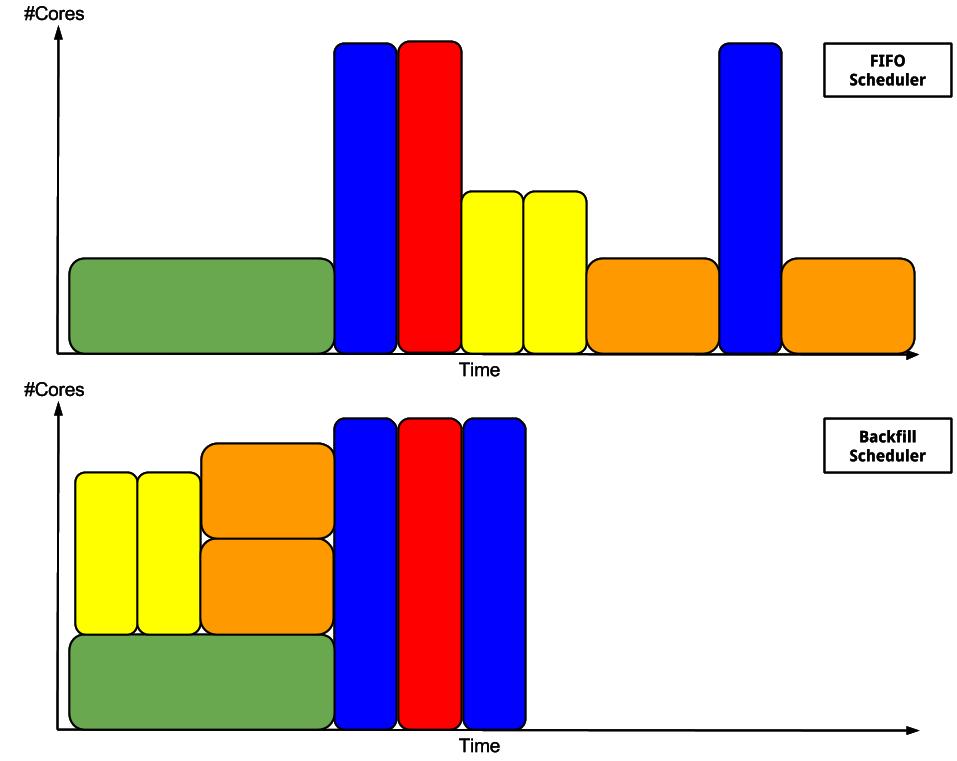
source: Scheduling. Slurm Training15. Salvador Martin & Jordi Blasco (HPCNow!)

Conclusion

You can see on the screenshot below the overall usage of the CPU resource during a whole day.
The goal is to increase this usage to around 80% which is considered the maximum on a general purpose cluster. So, help us to reach this goal and, use the resource wisely!

Thanks for reading :slight_smile:

4 Likes

Hi Yann,

Thanks for the instructions.

I was wondering if I am using the resources correctly then, because I use mono-shared partition for a 16 CPU request, and 100 jobs of these in parallel. Maybe others have a similar problem.

Each of the 100 parallel jobs has the following setup and takes on average 3 hours to solve.

Bash script

#SBATCH --partition=mono-shared-EL7
#SBATCH --time=11:50:00
#SBATCH --cpus-per-task=16
#SBATCH --ntasks=1
#SBATCH --mem-per-cpu=2000 # in MB

Each job is a mathematical optimization with Gurobi solver. I allow Gurobi to select the number of CPUs itself for the optimization, by setting threads=0.

Gurobi solver options on Cluster

solver_opts = {‘threads’: 0, ‘method’: 2, ‘crossover’: 0, ‘BarConvTol’: 1.e-5, ‘FeasibilityTol’: 1.e-6, ‘AggFill’: 0, ‘PreDual’: 0, ‘GURO_PAR_BARDENSETHRESH’: 200}

Dear Yann,

Thank you for all these informations. Is there a way to have a summary for one’s jobs, to know if one’s time estimations and CPU usages are good enough?

Another question. Suppose I’m submitting a very large number of jobs (e.g. 20k jobs, by batches of 1k every so often) and that these jobs have a highly random run time. Most take less than 4 hours but some can run 10-12 hours. If I request 12 hours per job, it will be over-estimate for most jobs but it’s the required margin of safety for the longer running ones. How would you improve this?

1 Like

I found something like this gives an idea of the time estimation accuracy:

sacct --starttime 2020-03-06 --format=User,JobID,Jobname,partition,state,time,start,end,elapsed,elapsedraw,timelimitraw,MaxRss,MaxVMSize,nnodes,ncpus,nodelist

I am wondering if it is a good way to do it.

I too have a rather random run time, which is a bit of a problem. I am trying to make estimates from the past executions of the same/similar workflows as a function of the input parameters…

But it looks like in some cases, the run time is a lot increased by the disk access from the node. I can not remedy this myself without finding a way to select the nodes more homogenously.

Cheers

Volodymyr

In general, you should stick with the safe margin. You have another possibility if your job your software support a checkpointing mechanism. In this case, SLURM can notify the job that it will be killed with some minutes margin. When the job receive this information, it should write the checkpoint. You can then relaunch the job a second time. This has an advantage, because you can ask even less time, for example one hour per job, and you’ll have much more opportunity to have you job picked by the scheduler.

1 Like

Indeed you can use sacct or sstat or even seff.

Example of one of your job (on the debug partition, no offense intended!):

[sagon@login2 ~] $ seff 30455298
Job ID: 30455298
Cluster: baobab
User/Group: savchenk/hpc_users
State: COMPLETED (exit code 0)
Cores: 1
CPU Utilized: 00:00:01
CPU Efficiency: 0.77% of 00:02:10 core-walltime
Job Wall-clock time: 00:02:10
Memory Utilized: 34.16 MB
Memory Efficiency: 1.14% of 2.93 GB
1 Like

An option that I found very usefull for job that have checkpoint or job that deliver interesting result at any time (e.g iterative optimisation algorithm) is the --time-min flag. This flag allows the sheduler to use a smaller time limit than --time if it allows the job to be backfilled before the normal time. This command is specially usefull just before a maintenance as it allows to squeeze a job just before the maintenance start.

1 Like

Sorry for reactivating this old thread but this sounds like a really useful feature. Are there tutorials on how to communicate with slurm about this kill signal from a running script?

1 Like

Hi,

are you talking about this? Gracefully quit when job is cancelled - #2 by Yann.Sagon